Measuring Change, Not Just Numbers

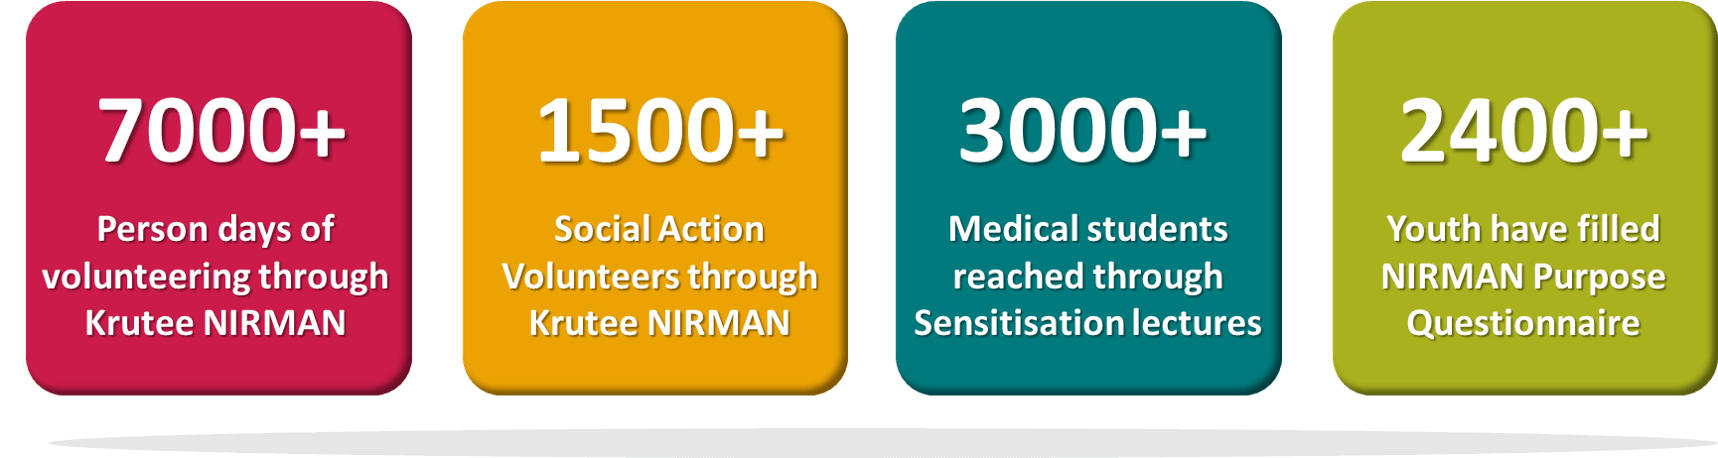
NOTE: All the metrics mentioned on this page pertain to the NIRMAN Workshop process and its participants. Outcomes and metrics of other NIRMAN activities are mentioned on those respective pages.
NIRMAN is not just selecting participants — it is shaping their thinking.
NIRMAN Selection Process
Every step in the NIRMAN selection process is an intervention in itself, designed to help the applicants self-reflect, voice their ideas/plans/concerns/doubts to a sounding board, achieve clarity and progress further in their journey of flourishing and social contribution.
Social Action Hit Ratio
Most of the participants when they join NIRMAN are studying in different institutes. From among the group of people who have graduated, 54% have engaged in social action.

54% of the total graduate NIRMANEEs have engaged in social action!

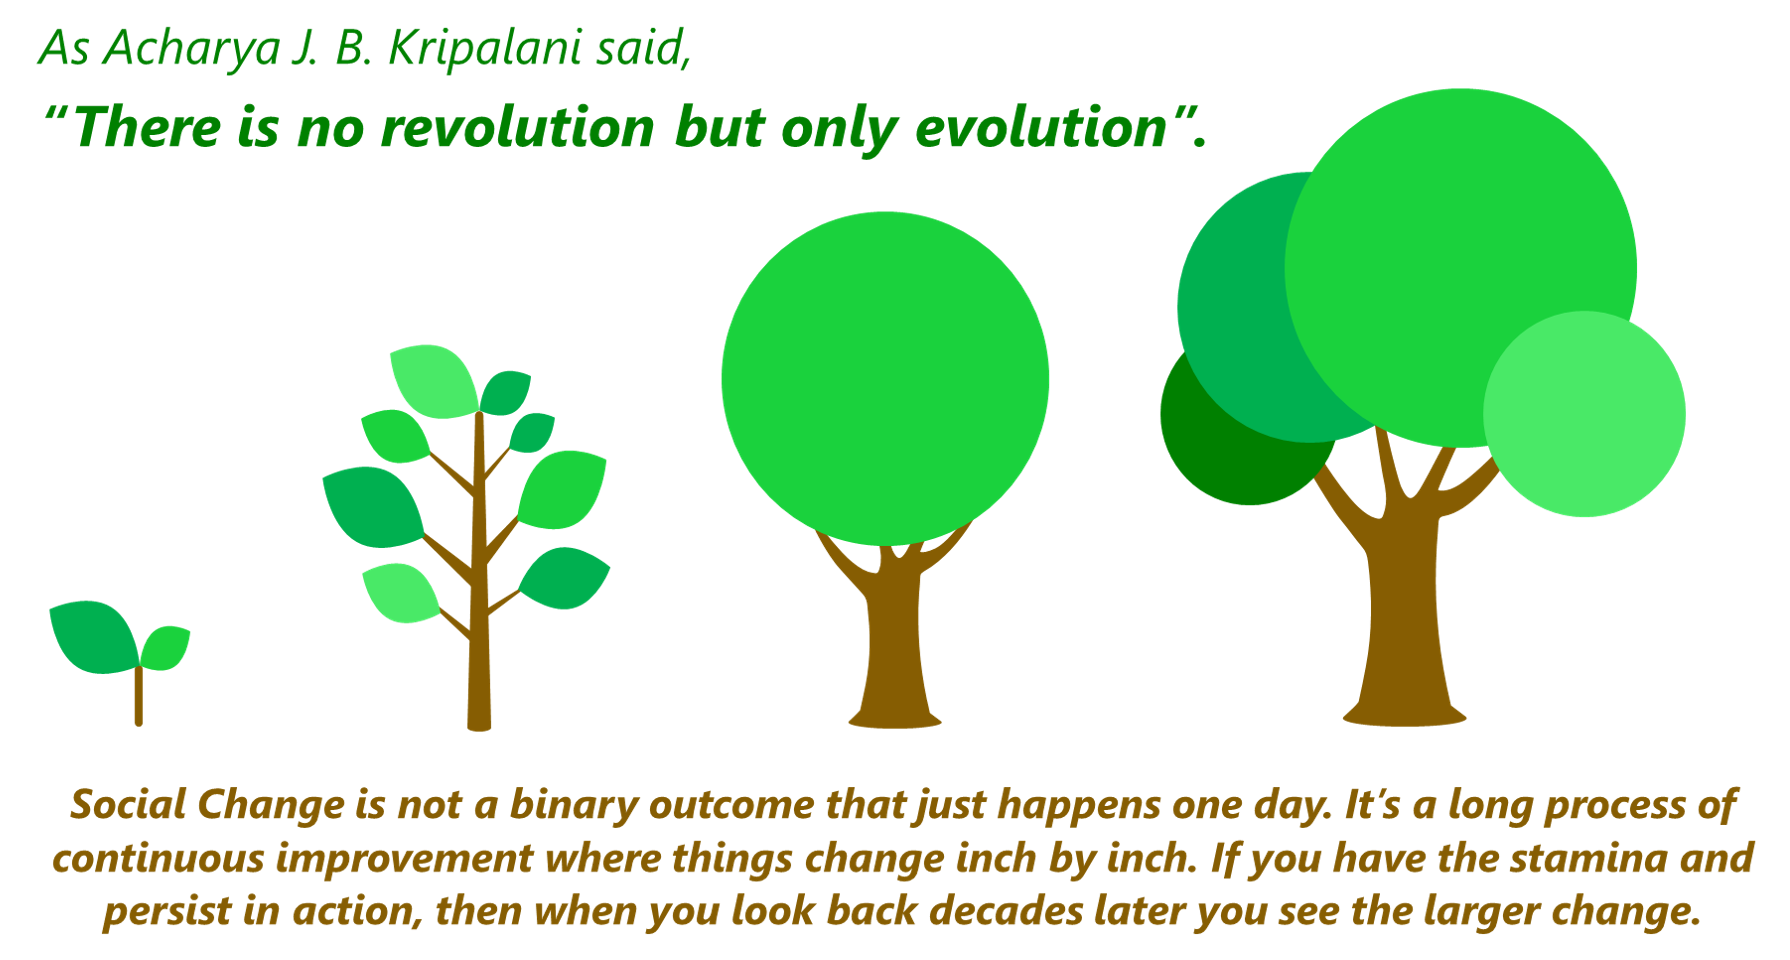
Person-Years of Social Contribution
Over the years a number of NIRMAN alumni have engaged full-time in social action and many of them continue to remain engaged till date. With every passing year, fresh graduates begin their journey of social changemaking while the ones who have started earlier become more senior, more experienced and hopefully will eventually become veterans in the field.

Diversity in the NIRMAN Community
Educational Composition
A mix of diverse backgrounds including Doctors, Engineers, Chartered Accountants, Science-Arts-Commerce Graduates, Social Workers, Lawyers, Journalists, Teachers, Farmers, Film Makers etc.
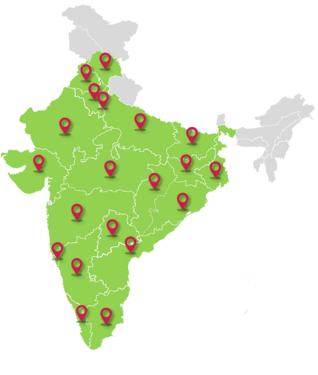
Geographic Spread
Participants have come from 23 different states of India. Since NIRMAN originated in Maharashtra, it has achieved a deeper penetration there with participants coming from all the 36 districts and from 316 out of 359 tehsils in Maharashtra.
Gender composition
Male/Female ratio is 51/49 (per 100)
Educational Institutions
Many participants from NIRMAN have pursued advanced degrees from some of the top educational institutions in India and abroad.
- IIT Bombay
- IIT Kanpur
- IIT Delhi
- IIT Madras
- IIT BHU
- IIT Indore
- BITS Pilani
- VNIT Nagpur SGGS
- Nanded Walchand Sangli
- COEP Pune
- PICT Pune
- VIT Pune
- MIT Pune
- GEC A'bad
- VJTI Mumbai
- UDCT Mumbai
- VIT Vellore
- IISc Bangalore
- IISER Pune
- IISER Bhopal
- IISER Tirupati
- ATREE Bangalore
- ILS Law College Pune
- CEPT Ahmedabad
- St. Xavier's Mumbai
- NID Ahmedabad
- Azim Premji University
- J. J. School of Arts Mumbai
- Asian School of Journalism
- IIM Indore
- TISS Mumbai
- Ranade Institute Pune
- AIIMS Delhi
- AIIMS Nagpur
- AIIMS Bhopal
- AIIMS Raipur
- BJMC Sasoon
- GMC Mumbai
- AIIMS Rishikesh
- GMC Nagpur
- JIPMER
- NIMHANS
- CIP Ranchi
- Sree Chitra Institute
- IIPH Gandhinagar SGPGI
- Lucknow GSMC KEM
- LTMMC Sion TNMC Nair
- IGGMC Nagpur
- MC Akola
- Johns Hopkins
- Harvard
- UPenn
- ASU
- Duke
- TU Delft
- Aachen University
- GMC Aurangabad
- GMC Miraj
- GMC Solapur
- GMC Kolhapur
- GMC Nanded
- GMC Yavatmal
- GMC Chandrapur
- MGIMS Sevagram
-
Action – Learning Interventions – In addition to its flagship training workshops and nurturance process, NIRMAN conducts a variety of programs for the sensitization, exposure, self-learning and action for a large number of young people.
-
Growth in Participants – Throughout the NIRMAN workshops process, the participants self-reflect and rate themselves on a variety of parameters. A before-after comparison and quantitative feedback allows us to see the growth/change in the participants’ self-conception of ideas and life choices. Few sample measures are as follows:
-
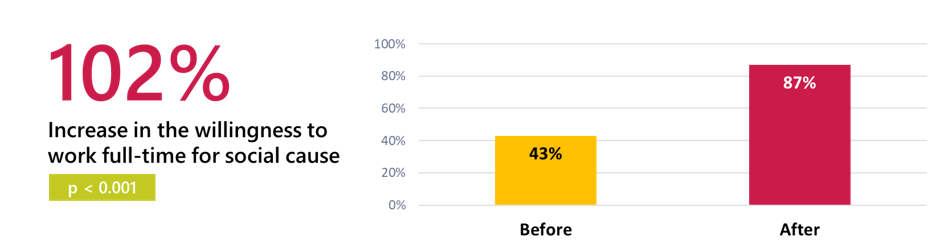
Preference of working full-time for a social cause: As the participants move forward in the NIRMAN process, there is a statistically significant increase (44 percentage point increase) in their willingness to contribute full-time for social change.
-
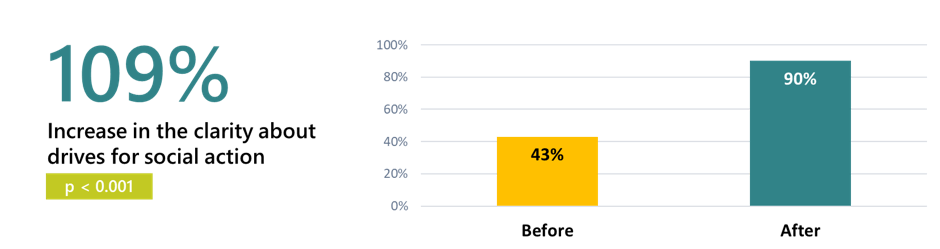
Clarity about drives for social action: The proportion of participants rating 4 or 5 out of 5 in response to the statement “I know quite clearly what are my personal drives/motivation for social action” increased by 47 percentage point from 43% to 90%.
-
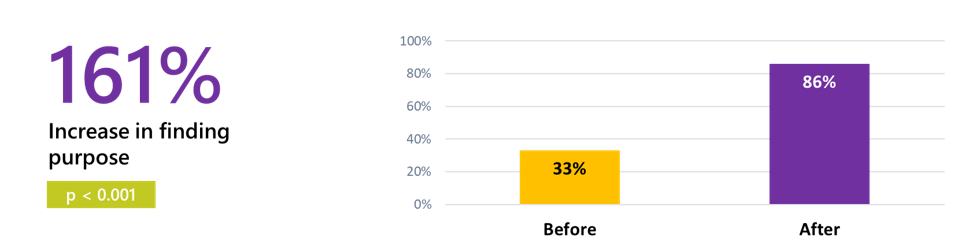
Finding purpose: The proportion of participants rating 4 or 5 out of 5 in response to the statement “I have found a purpose for my life” increased by 53 percentage point from 33% to 86%.
-
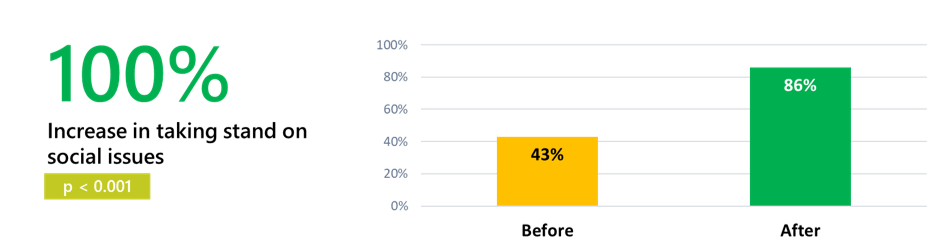
Taking stand on social issues: The proportion of participants rating 4 or 5 out of 5 in response to the statement “I can take a specific stand about various social issues around me” increased by 43 percentage point from 43% to 86%.
-
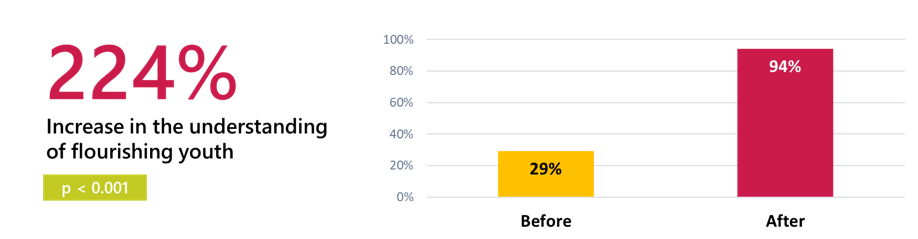
Understanding of flourishing youth: The proportion of participants rating 4 or 5 out of 5 in response to the statement “I know what it means to be a flourishing youth” increased by 66 percentage point from 29% to 94%.
-
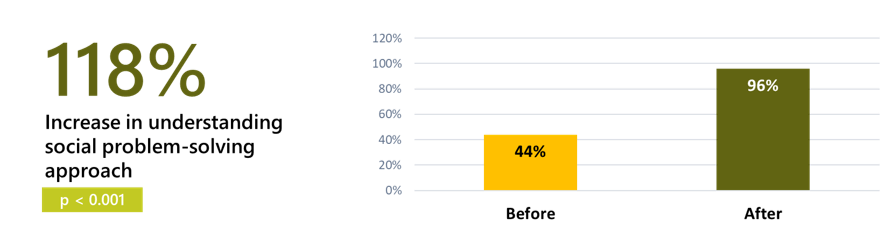
Understanding social problem-solving approach: The proportion of participants rating 4 or 5 out of 5 in response to the statement “I understand the difference between social work activities and the social problem-solving approach” increased by 51 percentage point from 44% to 96%.
-
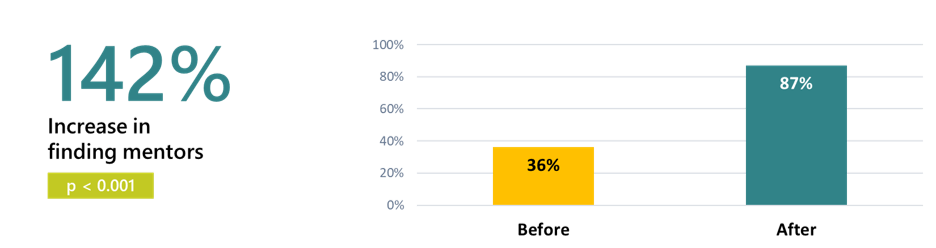
Finding mentors: The proportion of participants rating 4 or 5 out of 5 in response to the statement “I have mentors/facilitators I can talk to regarding myself, my confusions, my future plans” increased by 51 percentage point from 36% to 87%.
-
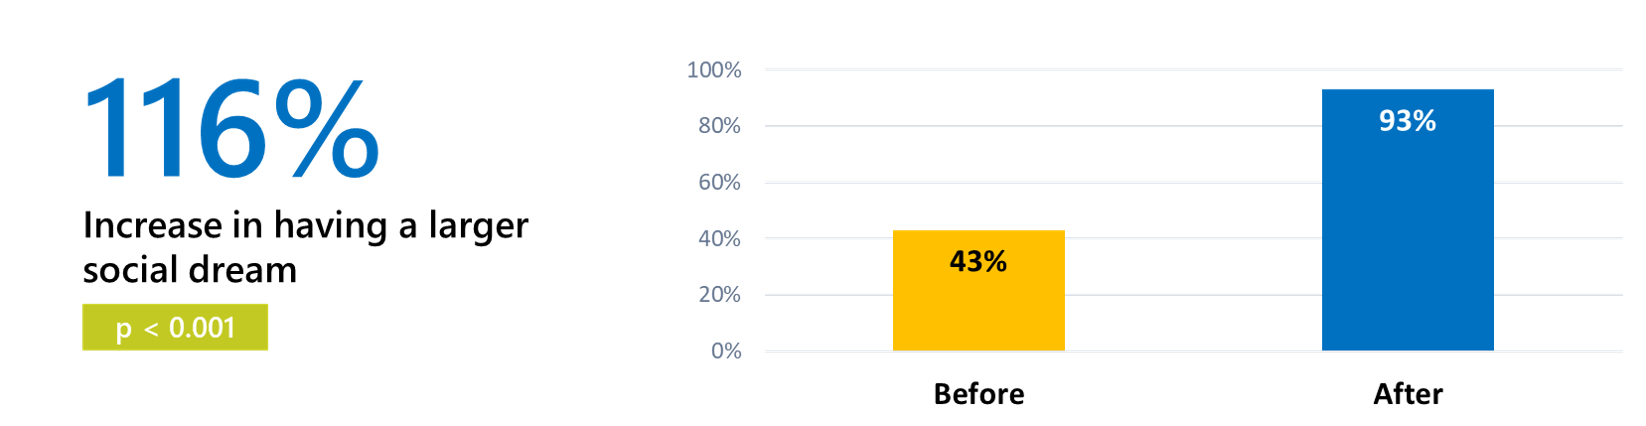
Social dream: The proportion of participants rating 4 or 5 out of 5 in response to the statement “I have a larger social dream that I can relate to” increased by 50 percentage point from 43% to 93%.
-
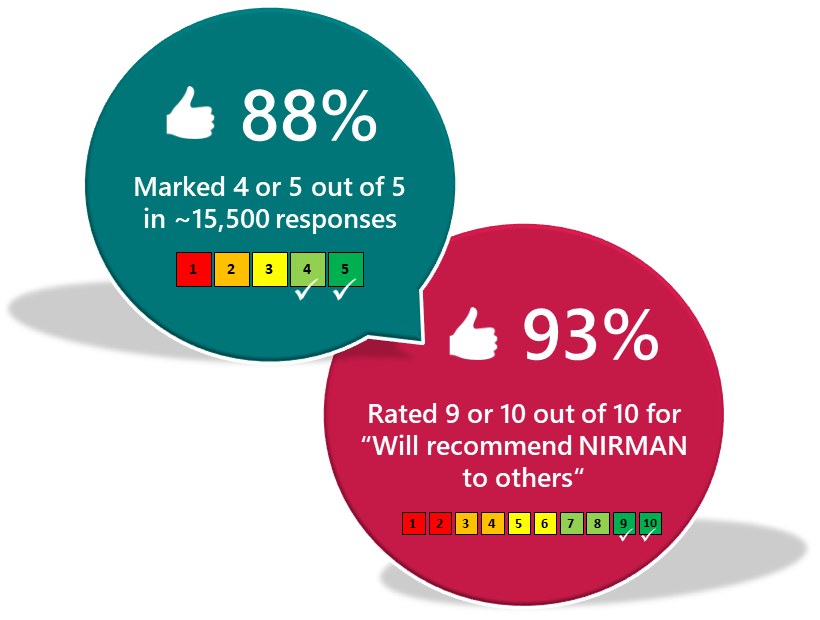
Quantitative feedback: When asked feedback about their development through the NIRMAN process on a variety of parameters, on a 1 – 5 scale (with 1 being the lowest and 5 being the highest), from over 15500+ responses that were collected, 88% responses were marked 4 or 5.
-
Net Promoter Score for Program recommendation: When asked on a 1 – 10 scale (with 1 being the lowest and 10 being the highest) regarding whether they will strongly recommend NIRMAN to others, 93% participants marked 9 or 10.
-
-
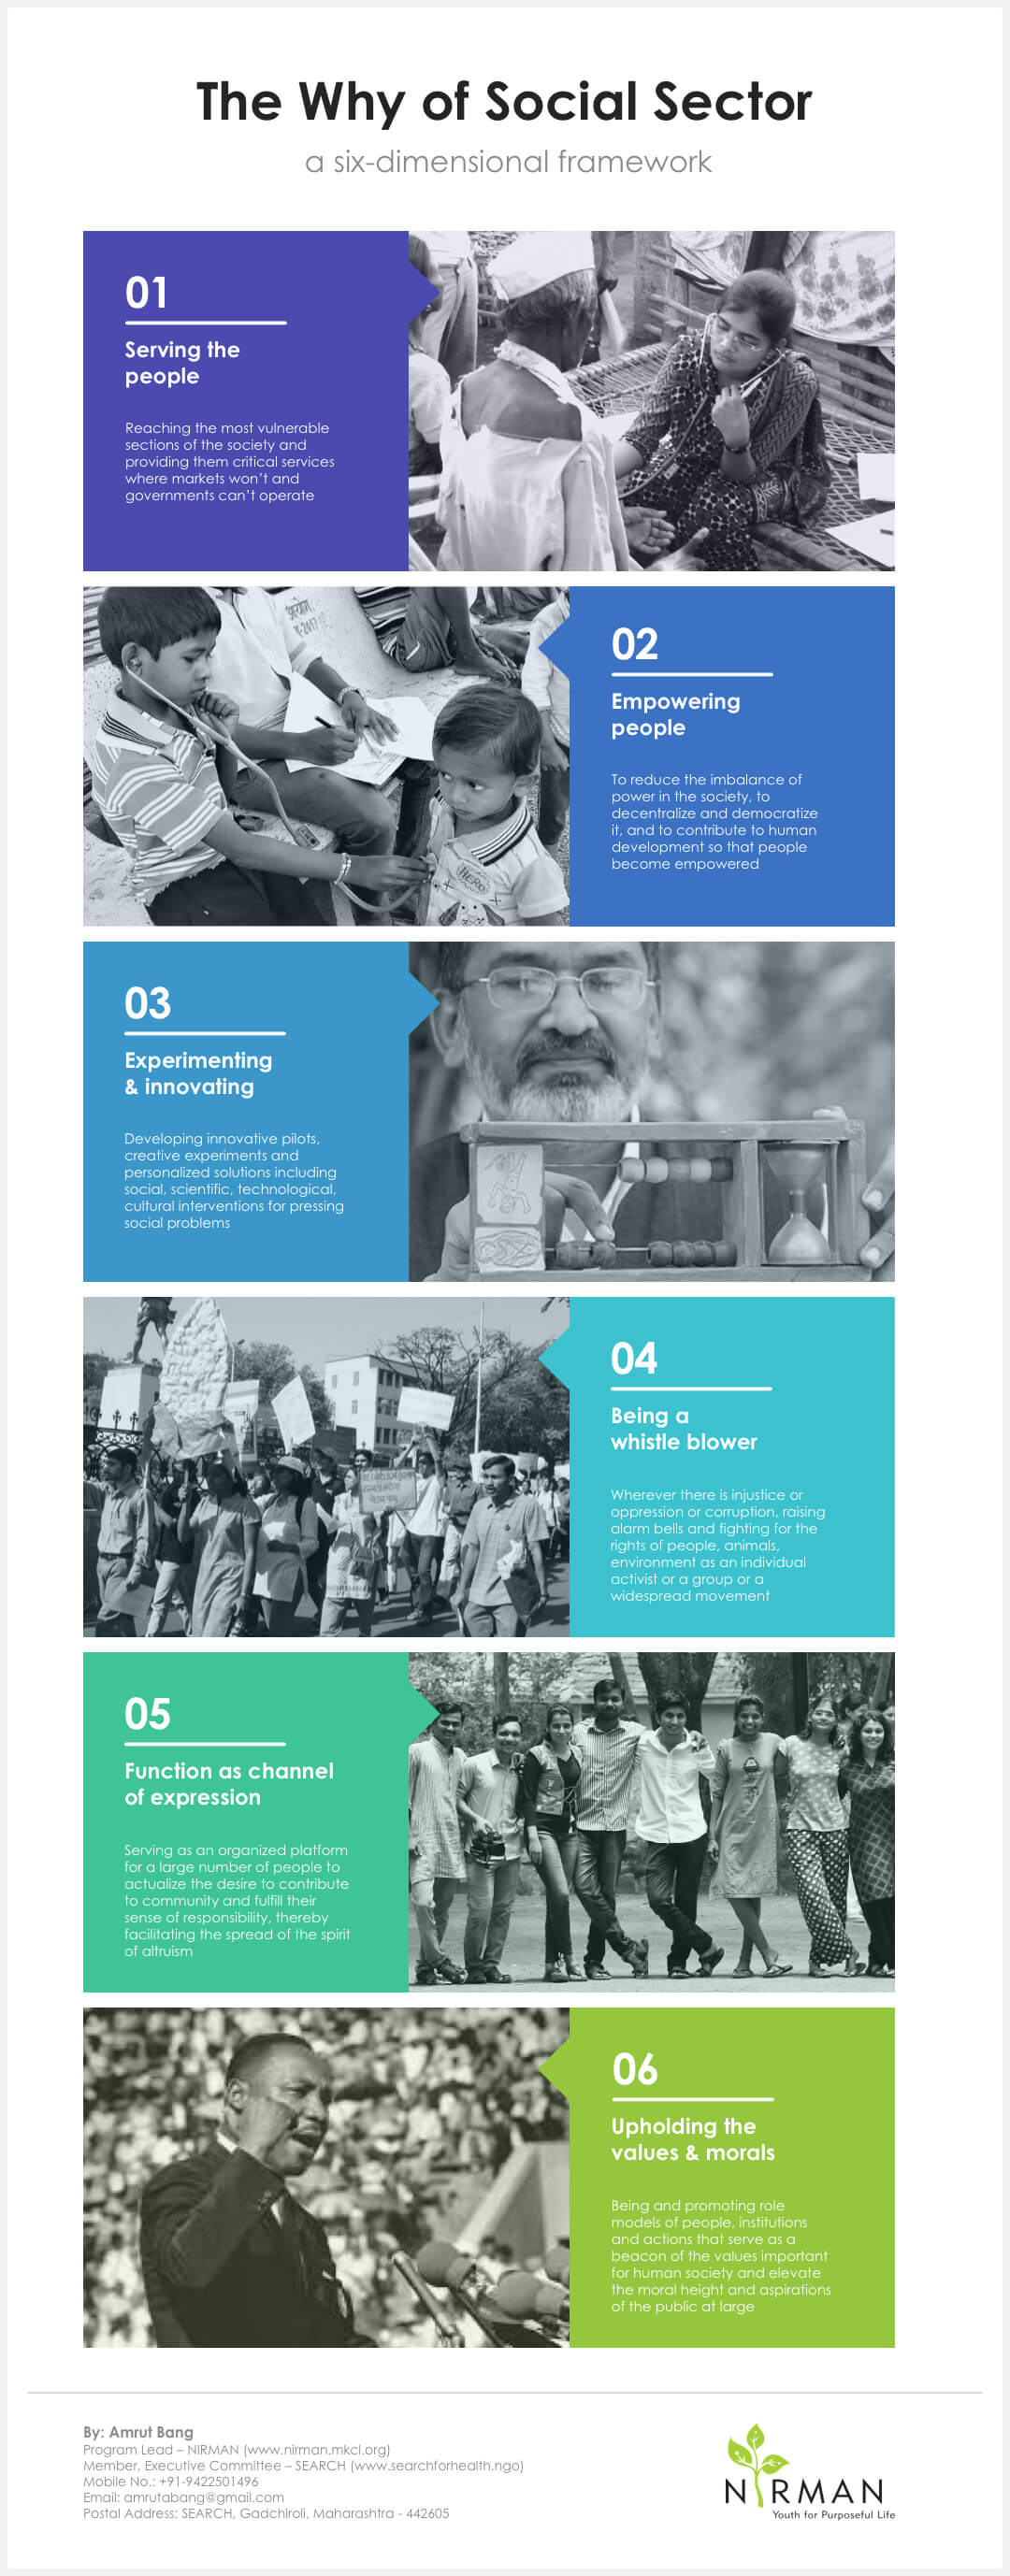
Knowledge Generation - Through the work with thousands of youth over the years and with a deep engagement in social changemaking, NIRMAN has developed multiple knowledge frameworks spanning range of topics like Youth Flourishing, Youth Leadership Development, The Why of Social Sector, etc. A case study on NIRMAN has been published in the textbook on Adolescent Psychology edited by Prof. Michael Nakkula of University of Pennsylvania and Prof. Andrew J. Schneider-Muñoz of Harvard University.
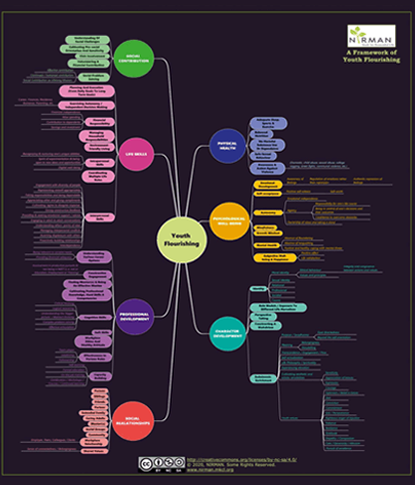
Youth Flourishing
Framework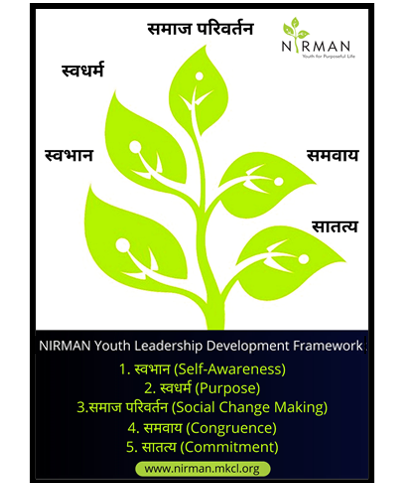
Youth Leadership
Development Framework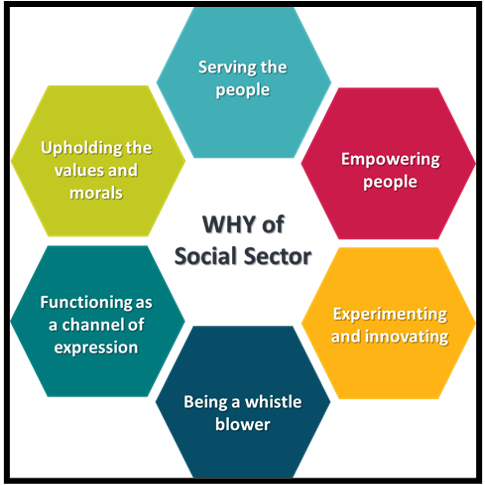
Why of Social Sector:
A Six Dimensional Framework
NIRMAN:
Case Study -
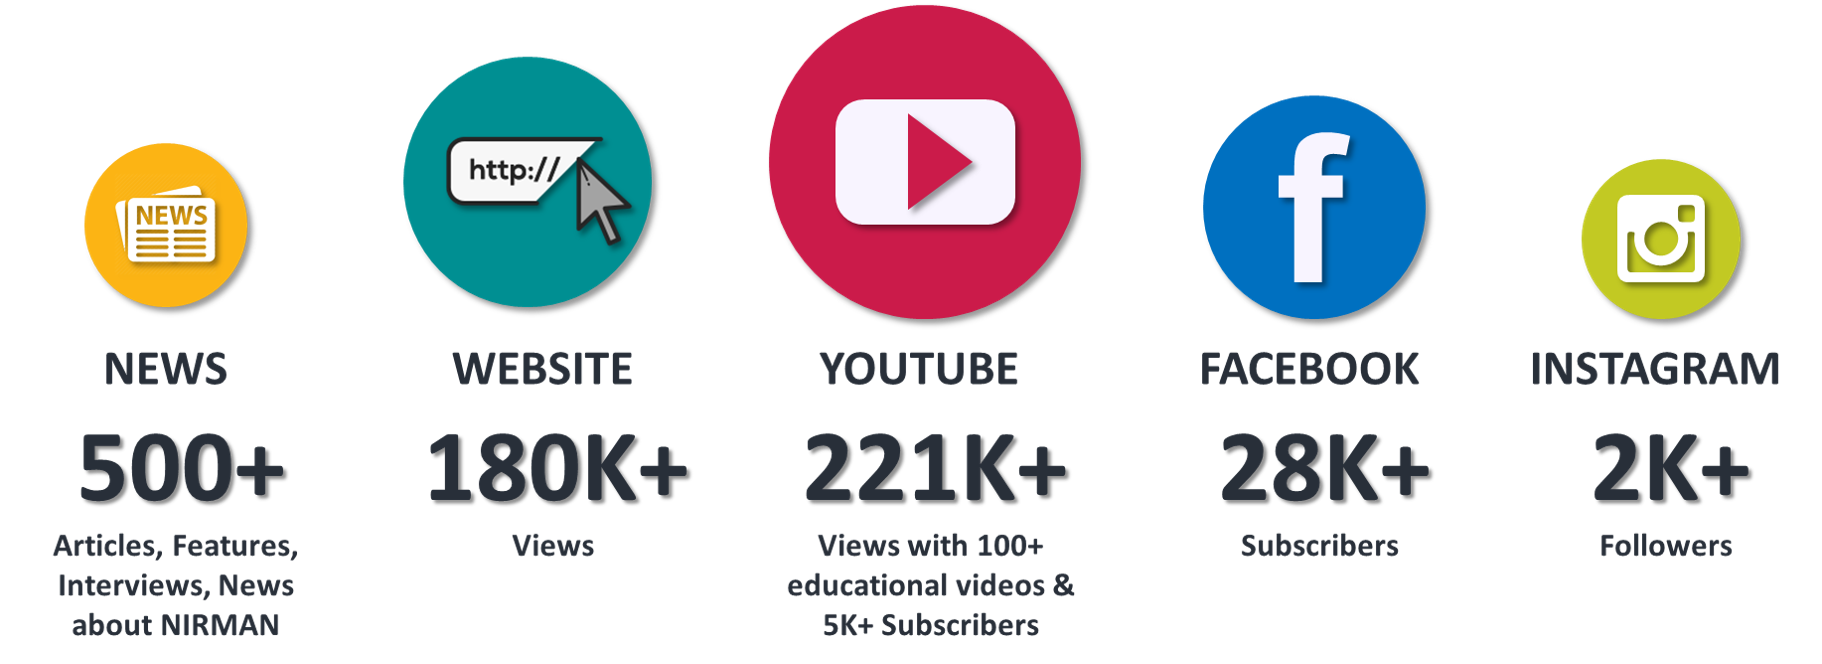
Media Coverage and e-Outreach – There have been over 500 articles, features, news, interviews about NIRMAN in various newspapers, magazines, TV, radio channels, social media and blogs, including The Wire, India Development Review, Down To Earth, The Logical Indian, Your Story, Ideas for India, Medium, Youth Ki Awaaz, Times of India, Economic Times, Indian Express, Loksatta, Lokmat, Maharashtra Times, Divya Marathi, Sakal, Sakal Times, Tarun Bharat, Pudhari, Punya Nagari, Deshonnati, Samana, Saptahik Sakal, Lokprabha, Sadhana, Anubhav, Maayboli, etc. Additionally, the website and social media of NIRMAN serve as a rich repository of diverse educational content.
-
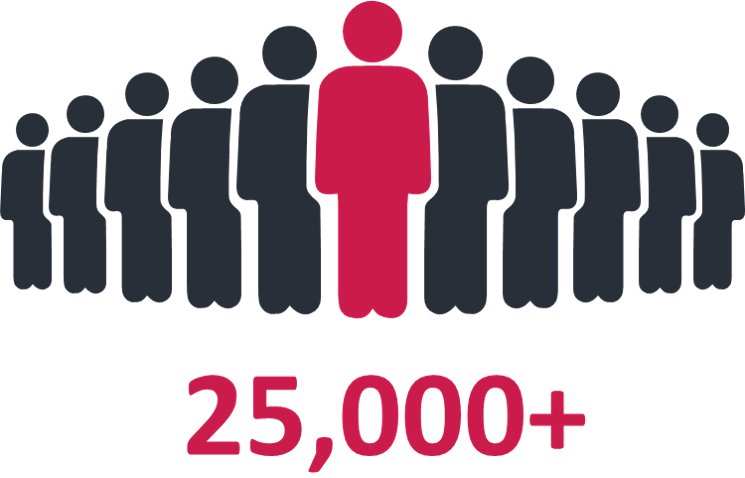
Youth Reached – The ten years of emerging adulthood, from 18 – 28 years, are foundational for the long-term development of a contributing and flourishing member of the society. This period consists of at least ~60,000 waking hours and how do youth utilize them determines their immediate and future growth. NIRMAN is invested in providing developmental inputs to young people during this period of life so as to facilitate their flourishing and nurture them as social contributors. Over the years, cumulatively, such developmental interventions have been delivered to ~25,000 youth.
-
Do It Yourself (DIY) Framework – The intrinsically complex nature of activities and challenges that social sector institutions are involved in makes it difficult to measure their impact. Yet that cannot and should not become an excuse. The yardstick of assessing success for social programs has to be different than the one used in the corporate sector. However, we should be all the more careful in bringing in meticulousness and rigour to our measurements. In its absence, a hurry to claim something as an “effective model” is misleading and hampers the credibility of the entire sector in the long run.
To crack this fuzzy of “impact”, one must remember that strictly by definition impact takes quite a few years to be achieved. But does that mean we should just wait for (say) 7 years without assessing anything? Not to mention that it would be demotivating for people to wait that long before any signs of success are seen, absence of feedback would also make it difficult to do mid-way course correction. In order to avoid this trap, we need a broader and more comprehensive assessment framework for impact. It has to be closely linked with program operations to give us information about progress at various levels of activities – outputs – outcomes as well as longer term social impact.
Based on this longitudinal view, appreciating the fact that performance has multiple dimensions and building on our foundation of the Why of Social Sector, we propose the following multifaceted framework for you to design your own program assessment metrics:
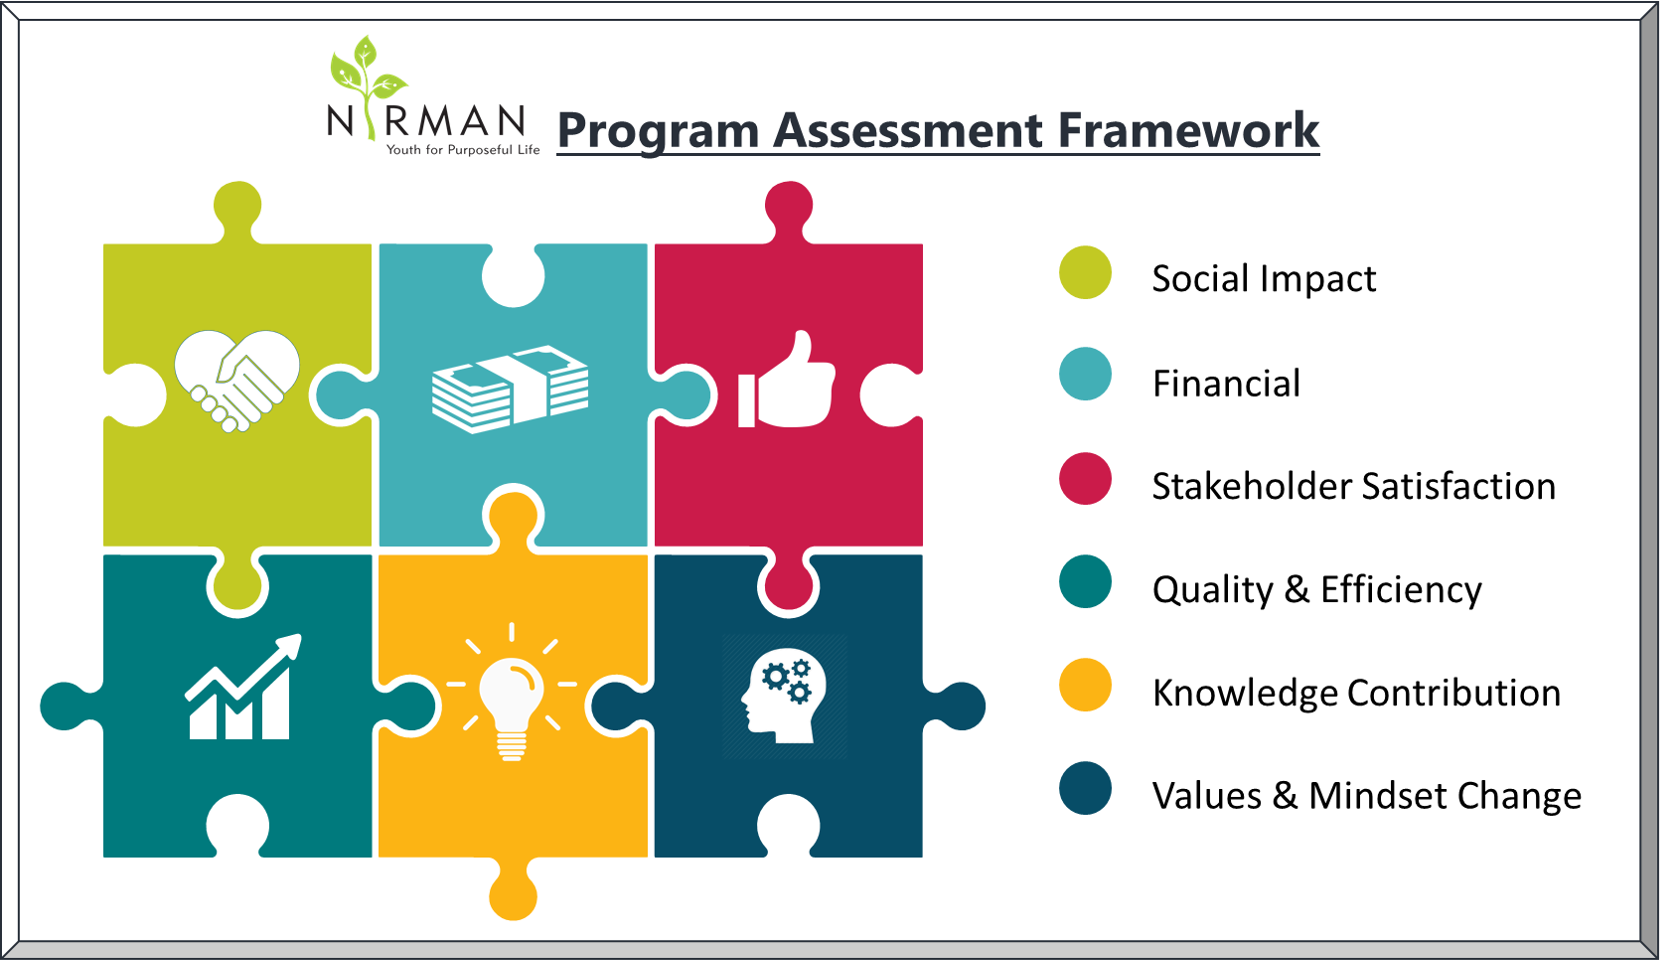
For each of the above dimensions, select the key parameters most relevant and important for your program and develop corresponding metrics. This page already demonstrates some of the various ways by which NIRMAN assesses itself. To give an additional example, in case of Financial Measures, the various metrics that we use include Total Revenue, Total Grants, Individual Contributions, Number of Individual Donors, Earned Income, % Growth in Revenue, Funder Diversification, Institutional Donor Retention Rate, Total Expenses, Program Cost Ratio, Personnel Cost Ratio, Self Sufficiency Ratio, Reliance Ratio, Unutilized Grant Ratio, Cost Per Person, etc.